Hidden Gems in Chrome DevTools: 9 Tips and Tricks
Posted on • Last updated on
Chrome has a great set of developer tools that allow you to dive into the internals of any website! Below are some of the most useful features that I use all the time for both front and back-end development.
A quick note: In case you don’t use Chrome DevTools often, you can access it by right-clicking any part of a web page and selecting “Inspect,“ or by going to the top menu bar, choosing “View,“ then “Developer,“ and finally, “Developer Tools.“ Also, I am writing this article while using Chrome version 121.
CSS Overview Tool
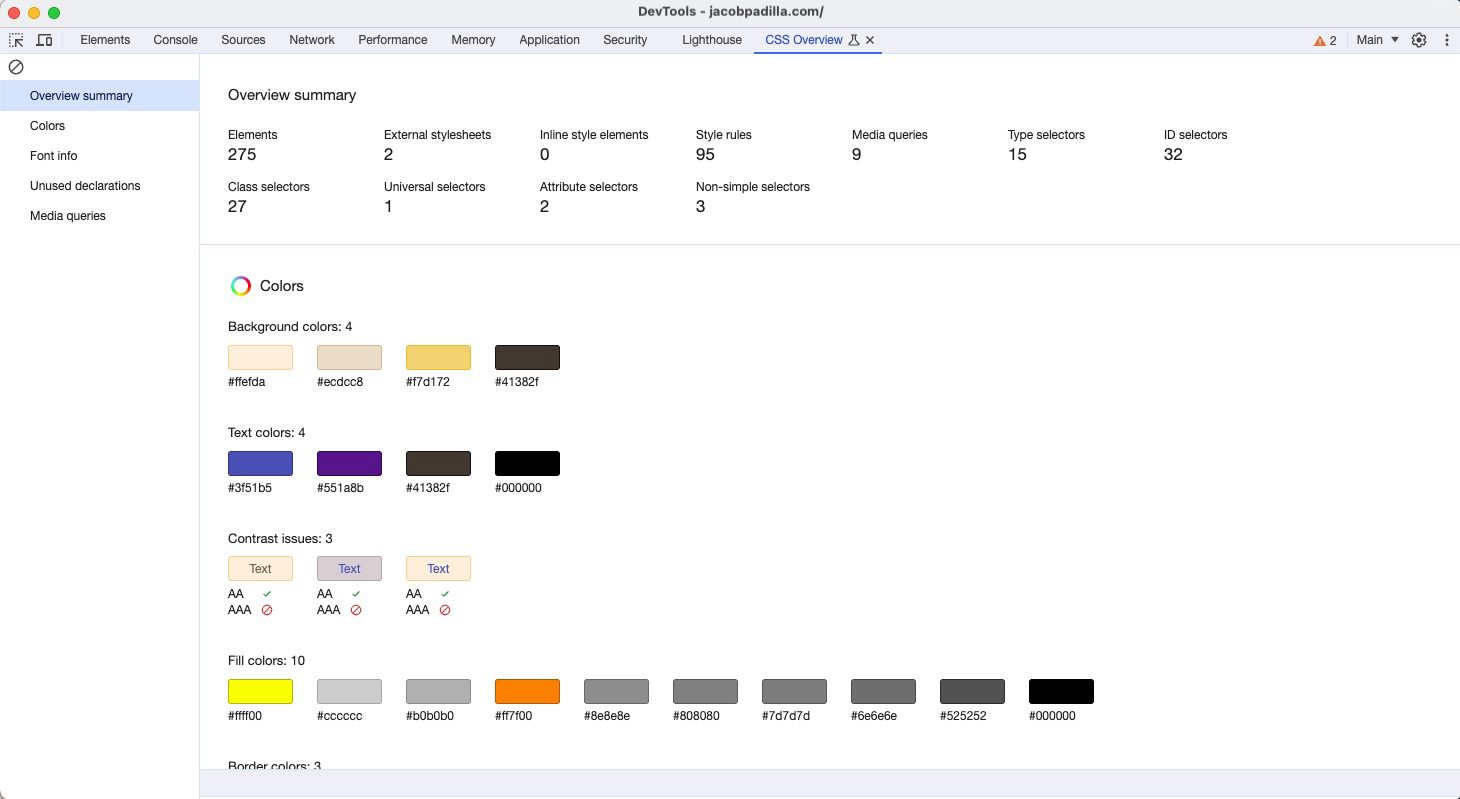
A really useful but somewhat unknown feature is their CSS Overview page. It’s a super handy page that gives you an overview of a website's styling, such as the most used colors, the distribution of fonts and font sizes, and other useful stats about your CSS, such as the number of media queries used.
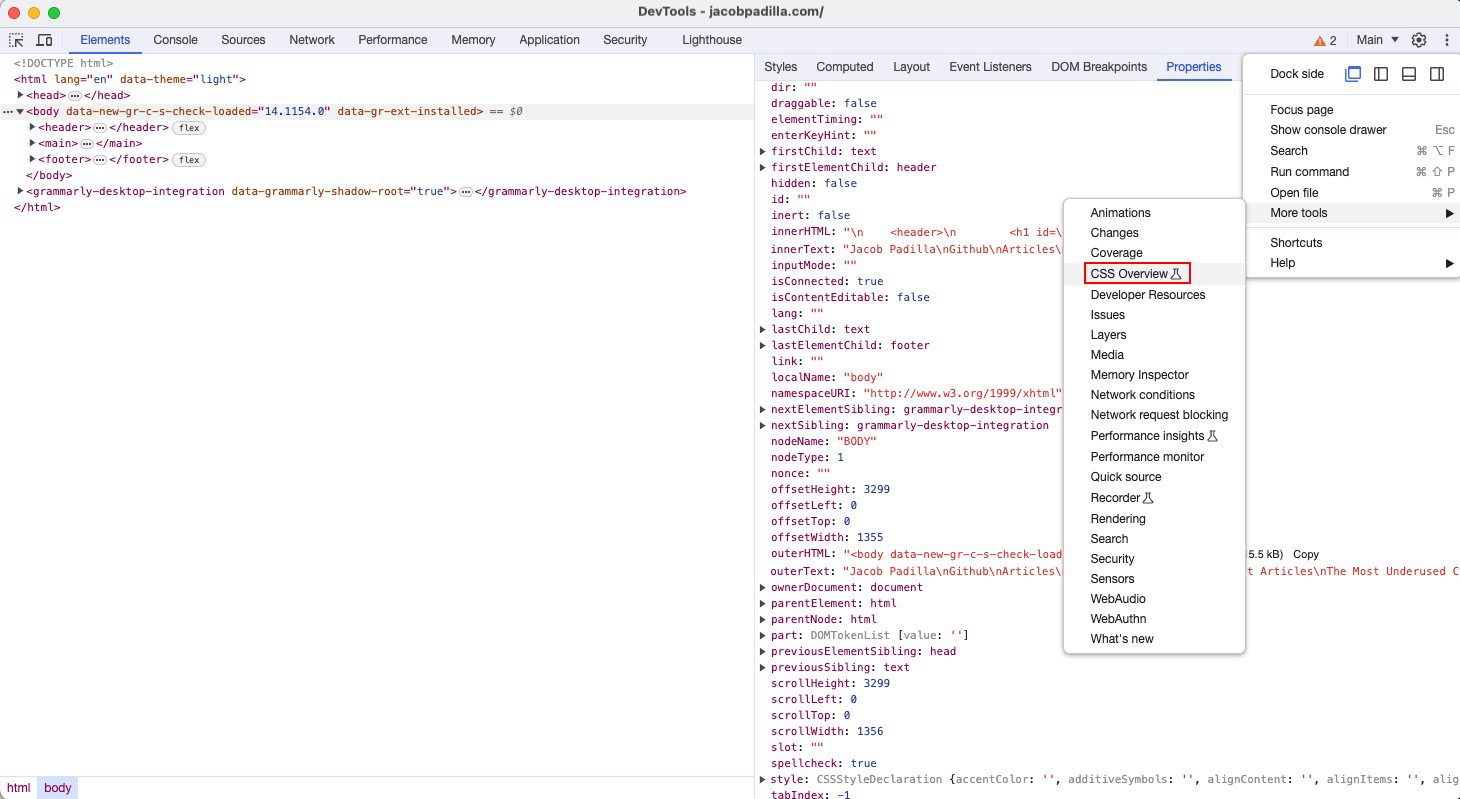
To access this page, click the three vertical dots on the right side of the screen, go to More Tools, and then click “CSS Overview.”
Once there, you’ll see a page like the one below. This is a snapshot of my website; we can see all of the text and background colors being used along with their contrast for accessibility purposes:
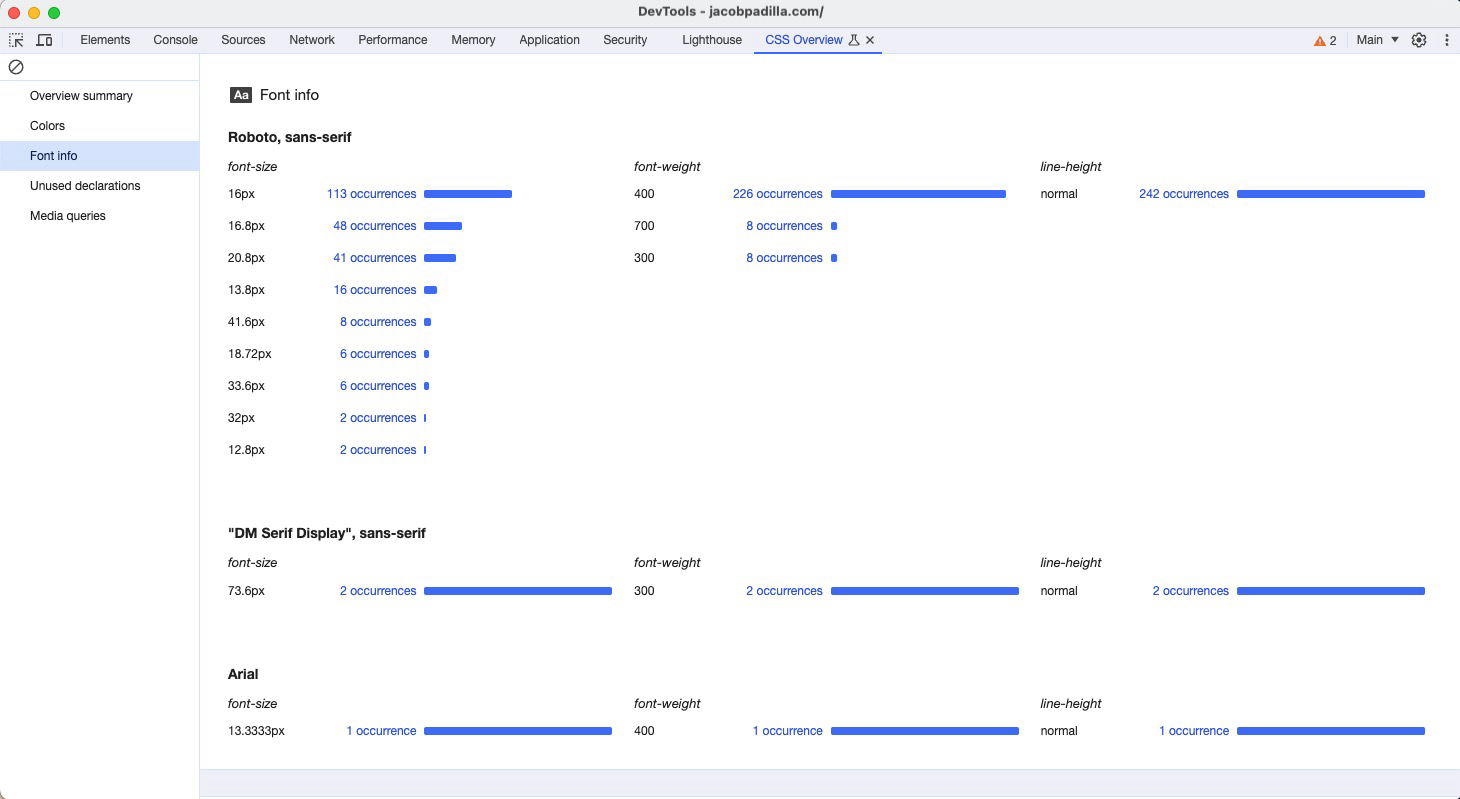
There are many things to look at on the CSS Overview page, but one thing I find especially useful is the “Font Info” tab. On this page, I can see the distribution of font sizes and weights on my website, which is super helpful!
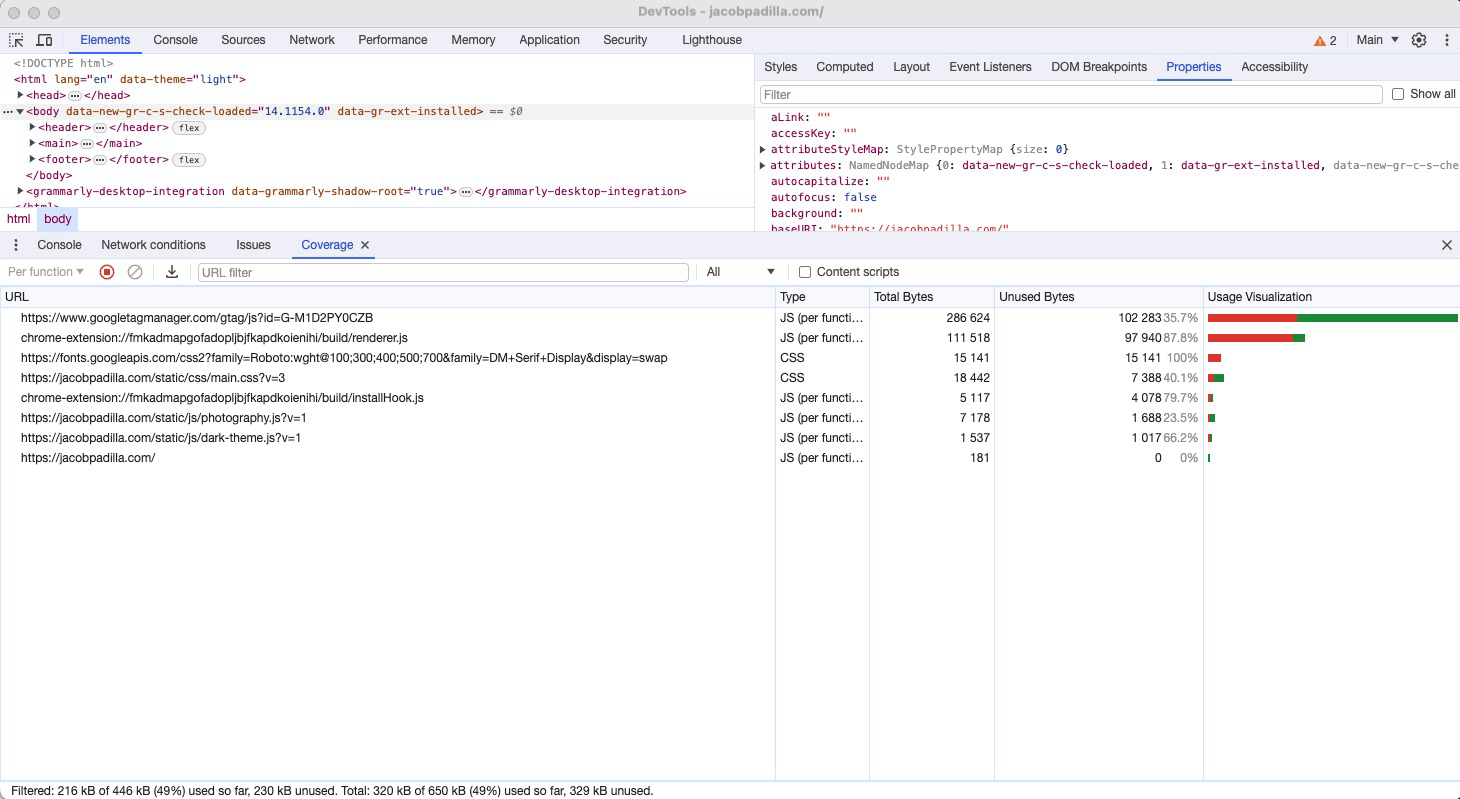
Code Coverage Tool
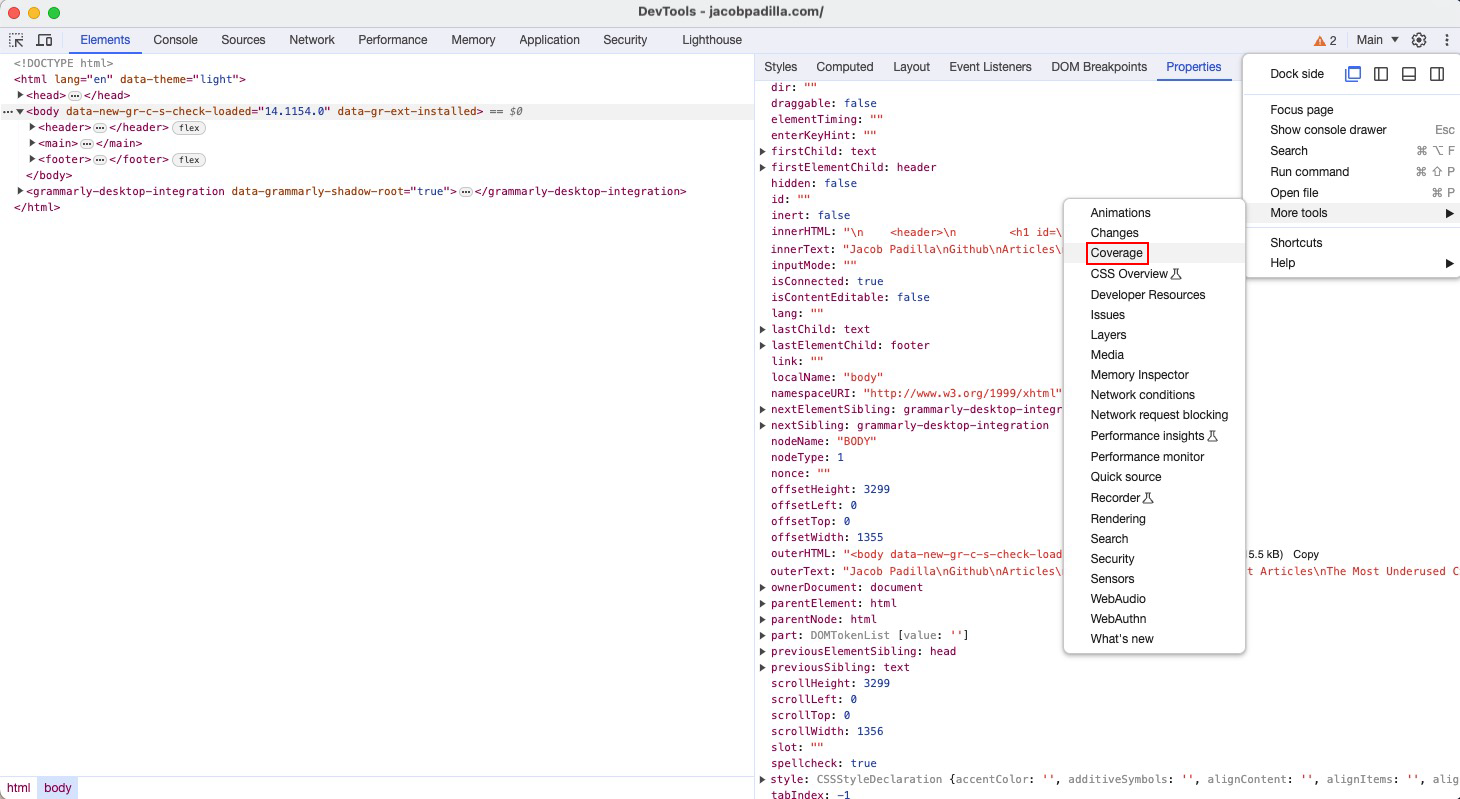
Another feature is their Code Coverage tool, which gives you statistics on which parts of a website's code base are being used. To open it, navigate to the three vertical dots, then under More Tools, click “Coverage.”
This will bring up a panel that shows you what percent of your files are not being used. For example, we can see that my dark-theme.js file has 1,537 bytes, but 66.2% of them are not being used – yikes.
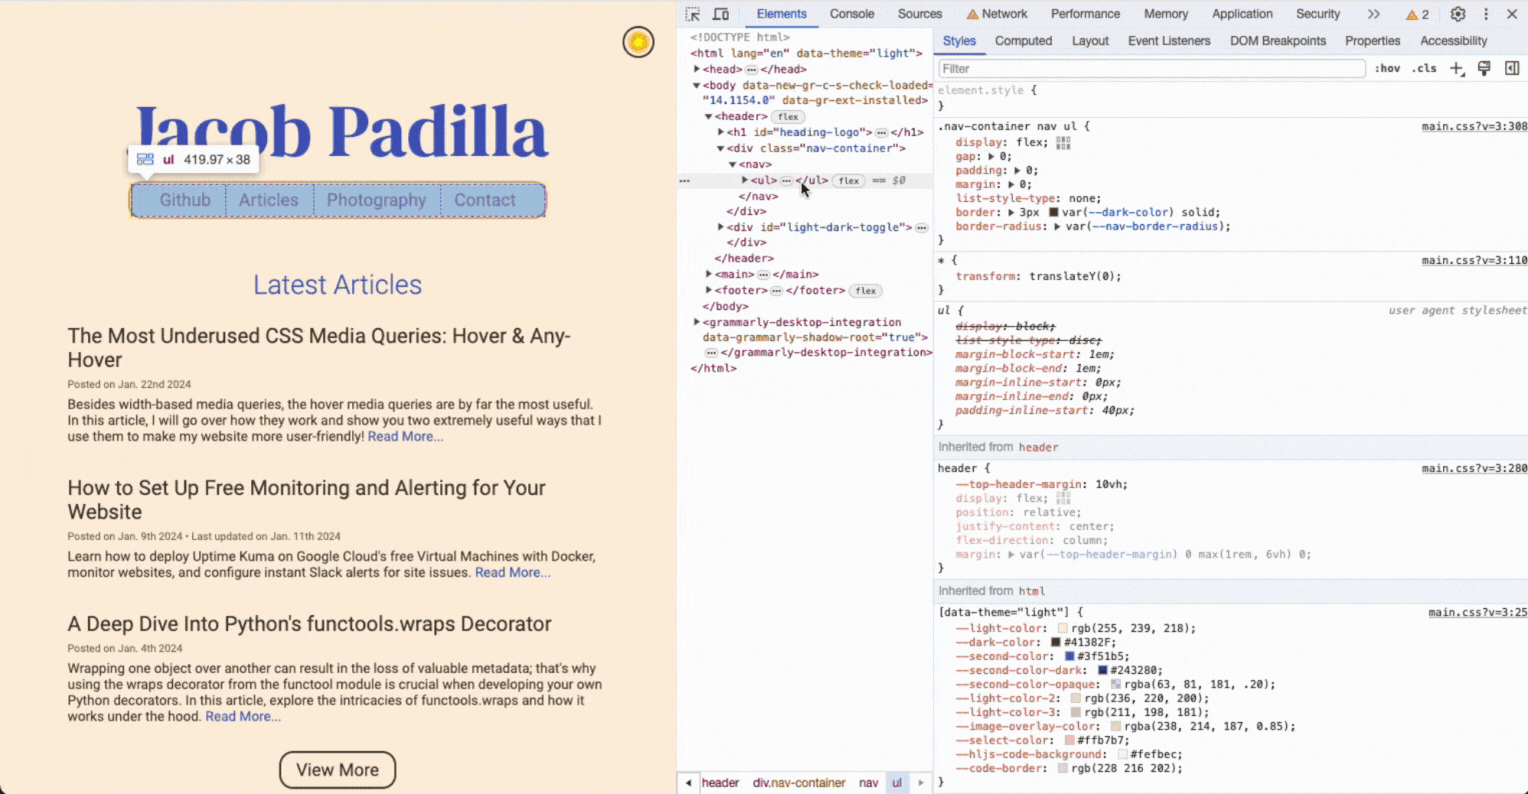
Dynamically Edit CSS Box Model
Have you ever been editing some CSS, trying to find the perfect margin, padding, border thickness, or width/height of an element? Using Inspect Elements to adjust a value, assess the appearance, and then modify it repeatedly until it's just right can be a pain. So, instead of doing that, just double-click the numbers in the box-model visualization and use the arrow keys to dynamically increase or decrease the box-model numbers in real time! Using this feature can save a bunch of time and lets you easily finely adjust certain dimensions.
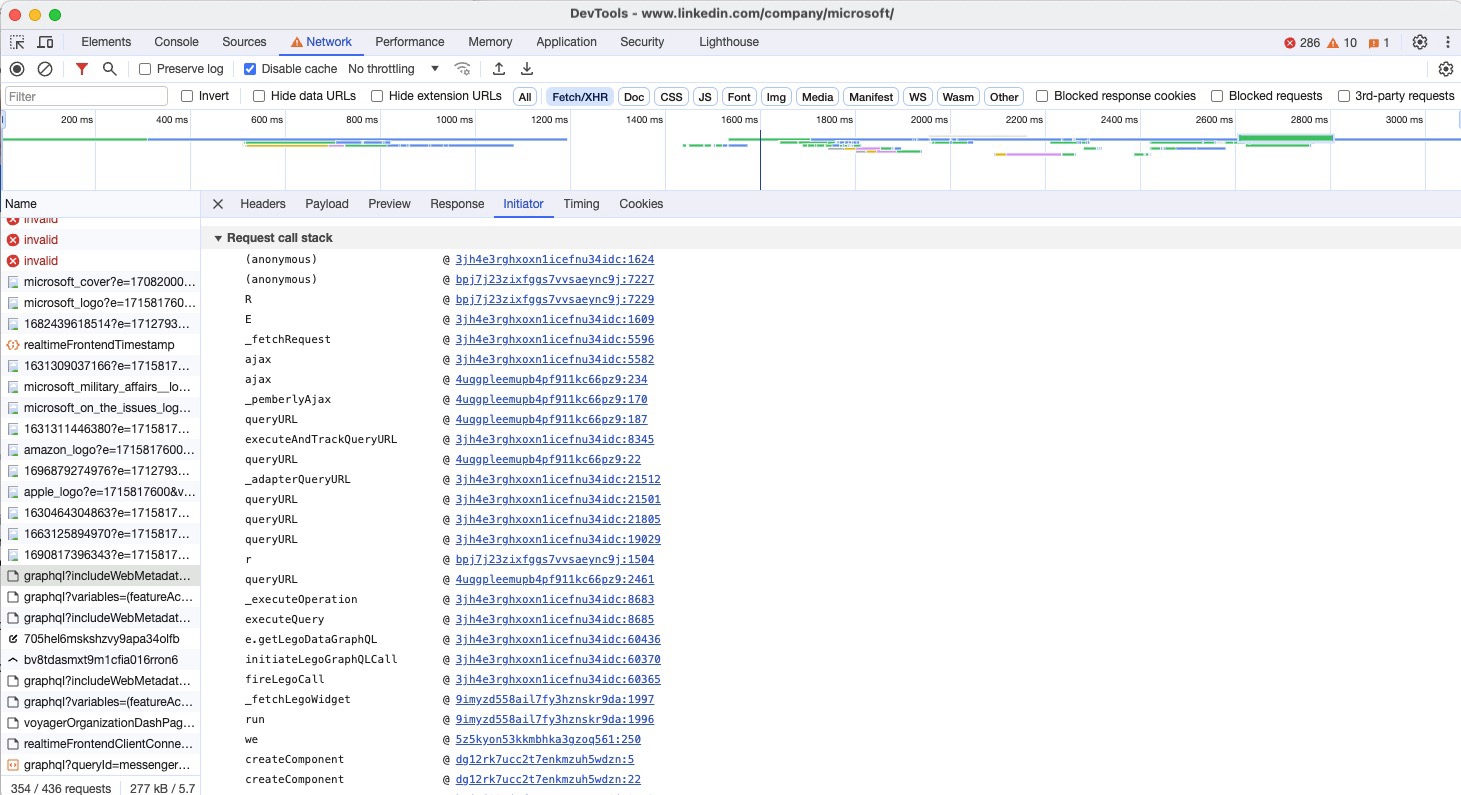
Finding Request Origins
This next tip is very useful for reverse engineering an API. When clicking on a specific request in the Network tab, you can go to the “Initiator” part of a request to see exactly where it was sent from. This feature is especially useful for the requests made with Javascript since you can then go to the JS file and see exactly how each request was compiled before sending it.
Let’s say we’ve found an interesting request that we want to learn more about. Below is a GraphQL request made by LinkedIn:
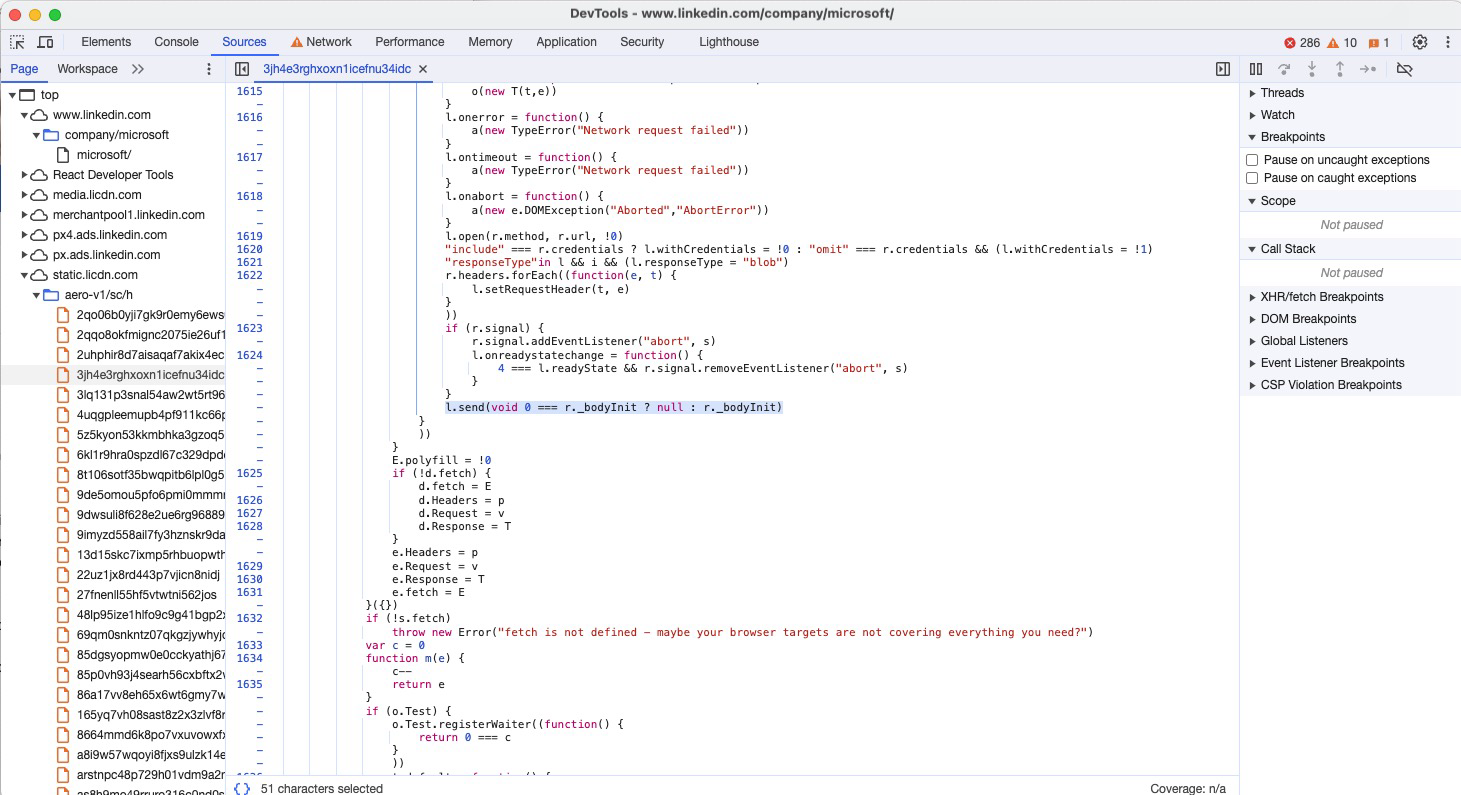
If you click the top link (the final function that made the HTTP request), it will take you to exactly where the request was sent from. To be fair, their code is quite obfuscated, but with enough time, you can understand what it does enough to then reverse engineer the API endpoint.
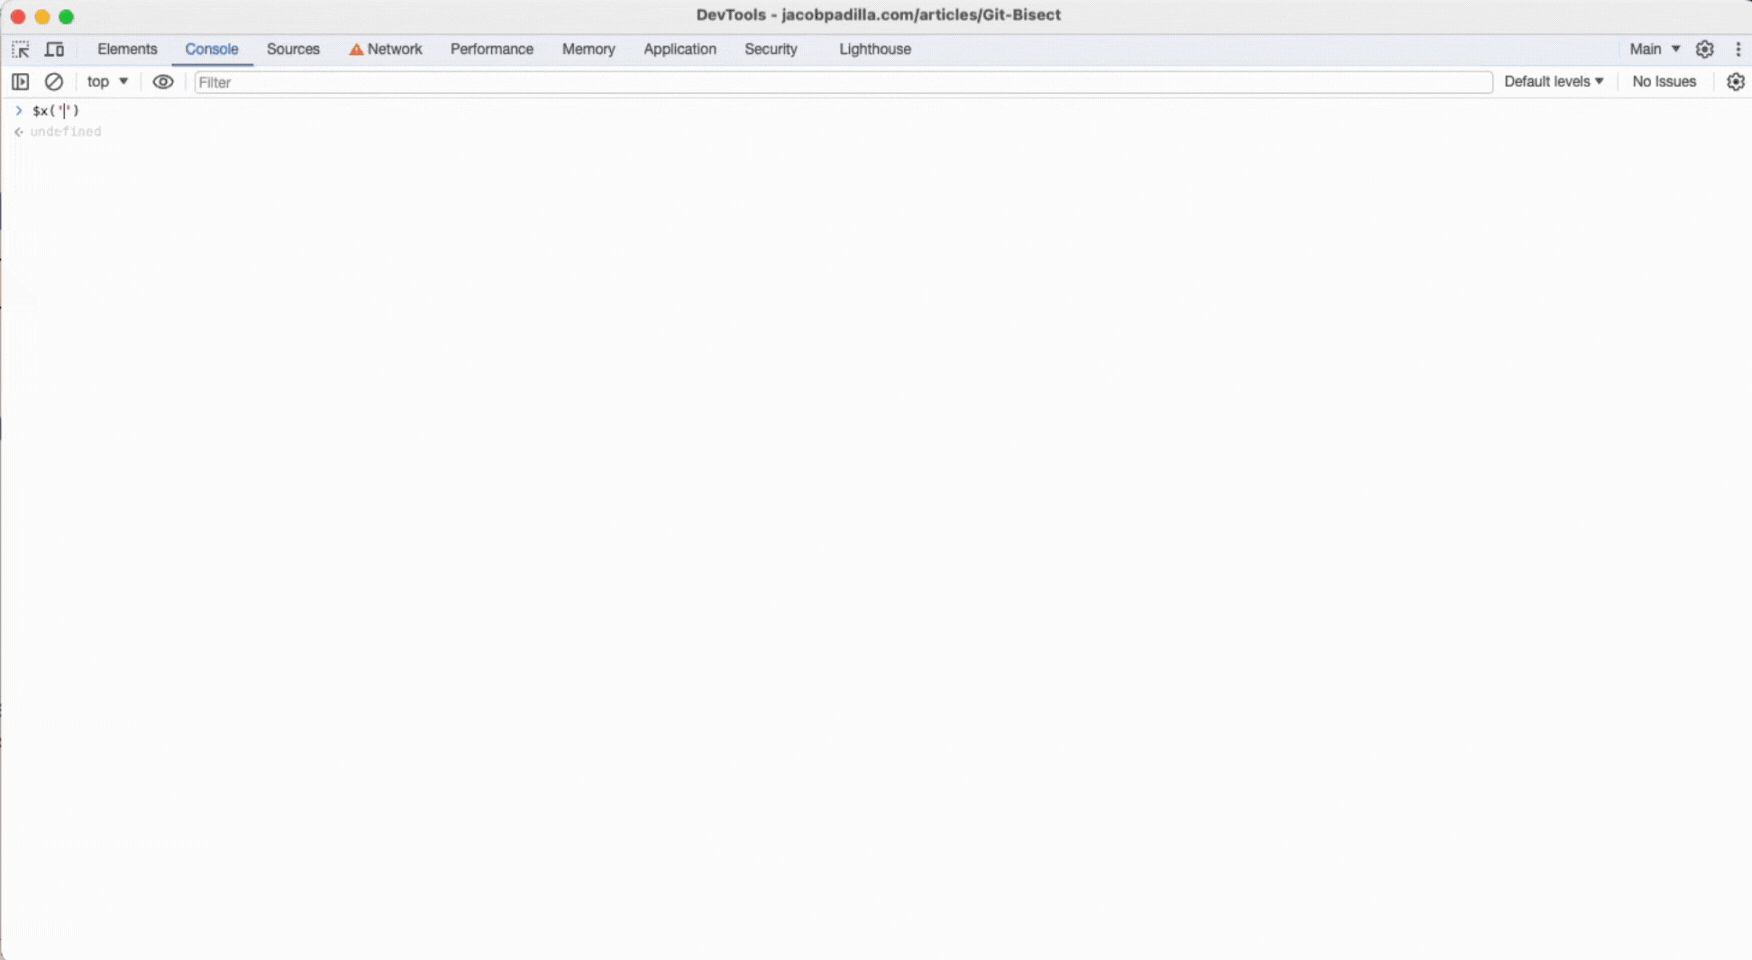
Validate XPath in the Browser
This is a must-know tip if you’re doing anything with XPath expressions. By going to the Console tab and typing in x$(‘’), you can write an XPath expression inside of the quotes, and the console will dynamically show you which elements the expression is selecting. After writing the XPath expression, click Enter to get a result object that lets you actually go to the HTML that was selected to verify that your expression is correct.
As you can see in the example, the number of results in the list is getting smaller and smaller as I narrow in the search:
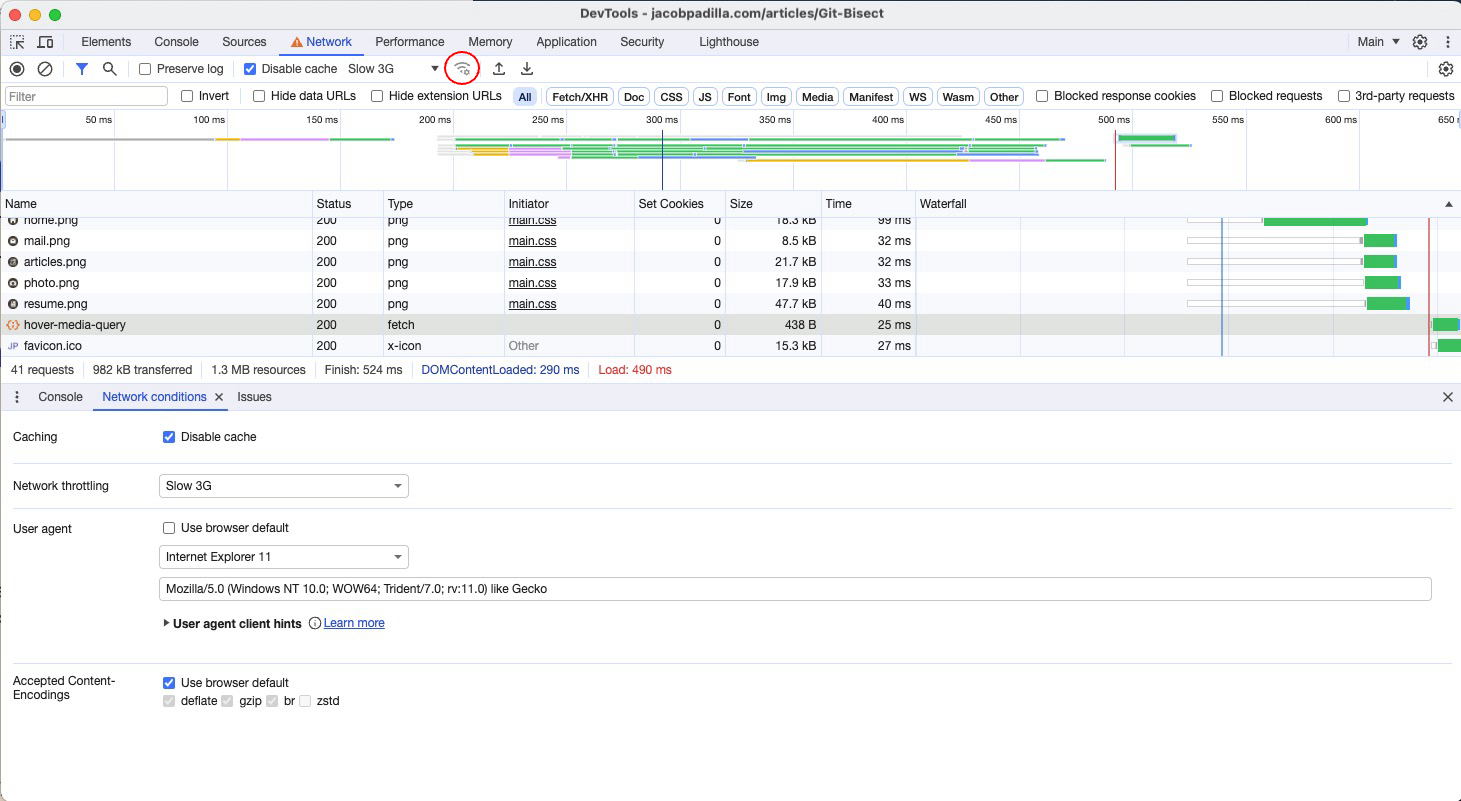
Network Settings
Another useful feature of Chrome DevTools is the ability to simulate different network conditions. You can adjust your network speed to simulate slow internet speeds, disable caching of HTTP responses (covered in the next tip), and also change the user agent for outgoing requests. To open the “Network conditions” panel, click the wifi button circled in red:
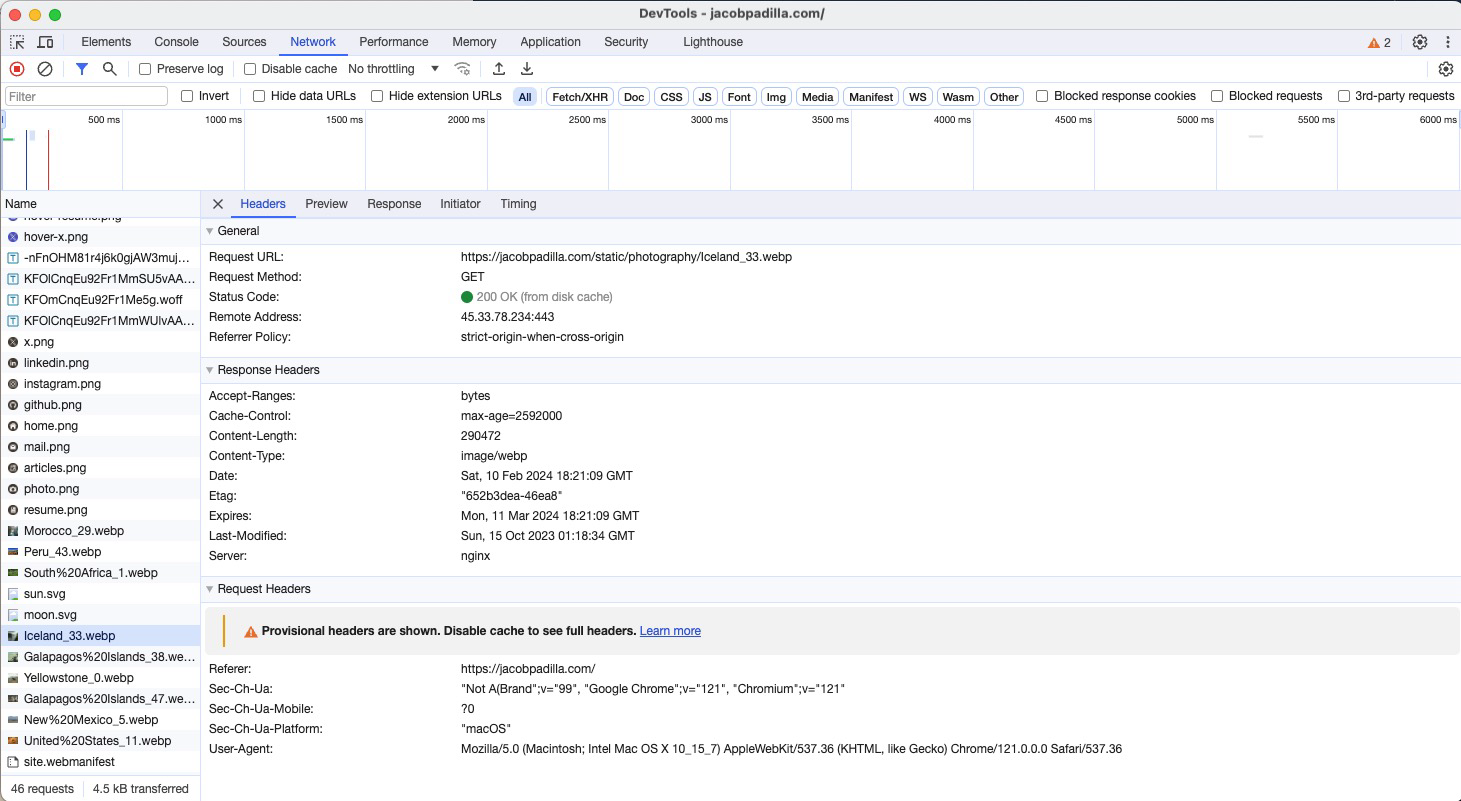
Disable Caching
When developing a website, you often don’t want requests to be cached. Fortunately, Chrome DevTools provides a convenient button to disable caching! You can either check the “Caching” button in the Network tab from above or click the “Disable Cache” button at the top of the page.
Below is an example of a cached request:
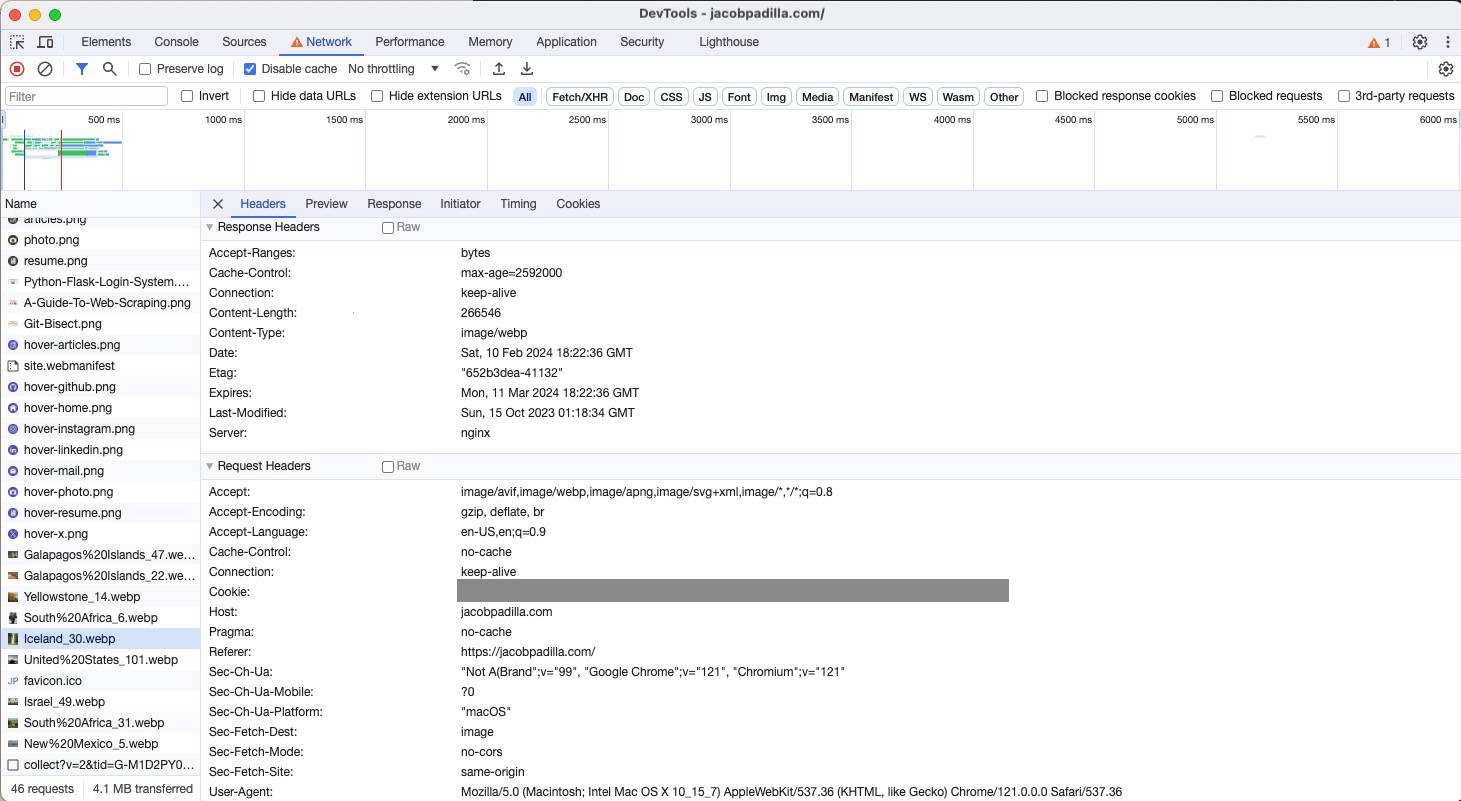
But, after disabling caching, it will send a new HTTP request to every URL, allowing you to see changes in requests.
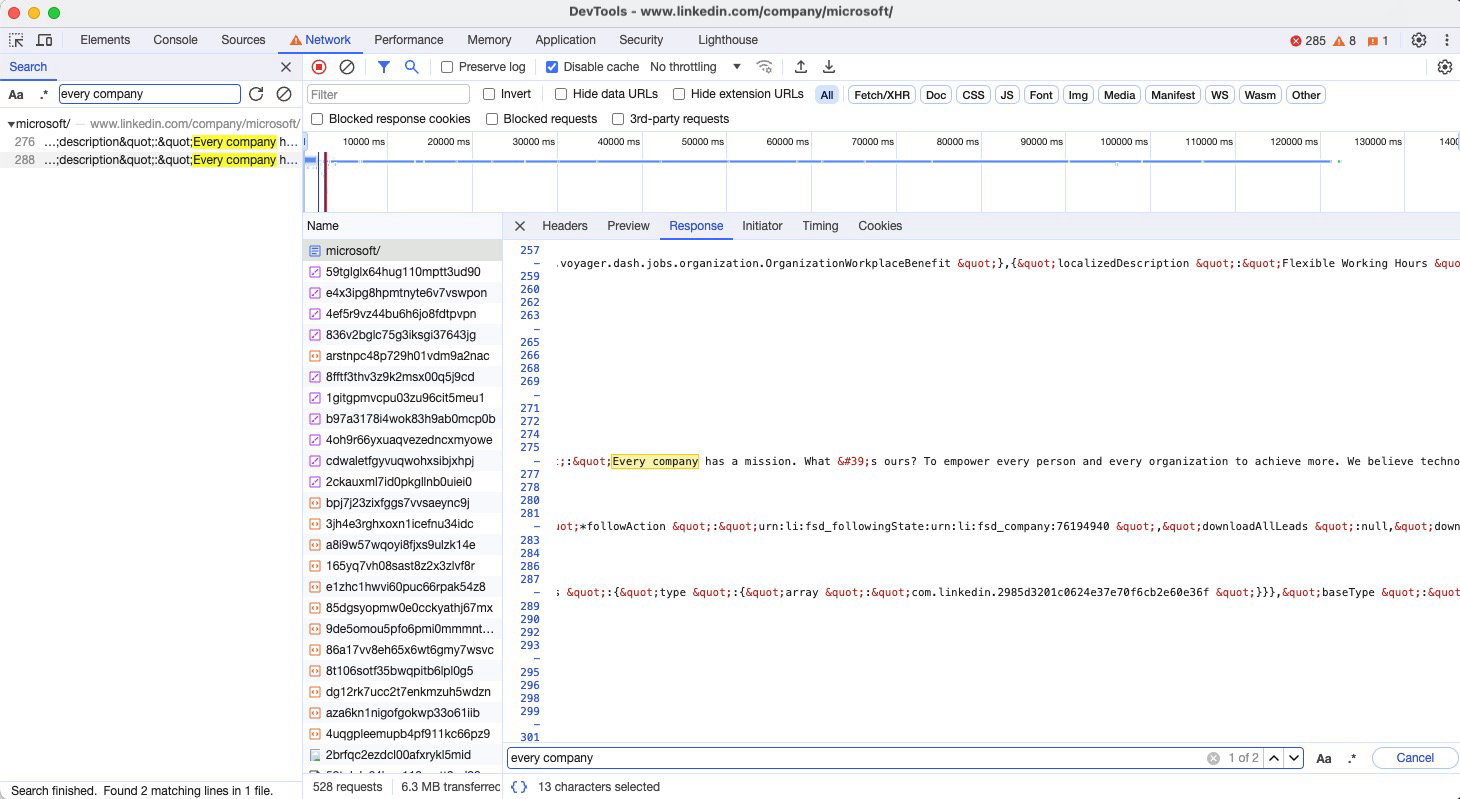
Locate Data in Requests
Another really handy way that I use Inspect elements is to figure out which request sent a specific piece of data. If you, for example, want to scrape data from a website, you first need to know which request is actually retrieving the data that you want so that you can then send a request directly to that endpoint.
Let’s say that we want to scrape the “About” section of LinkedIn company profiles:

We can go to the Network tab of Inspect Elements and press either the magnifying glass or command + F to open the search bar. Then, start typing the words from the “About” section into the search bar until you’ve narrowed down the result to just a few requests. I should note that while this is usually a quick way to locate which request the data is coming from, if the response data is encoded this method won’t work.
In this case, when clicking on the result from the search area, we can see that the data is rendered on the server and sent in the initial HTTP request to the page.
Lighthouse Performance Tester
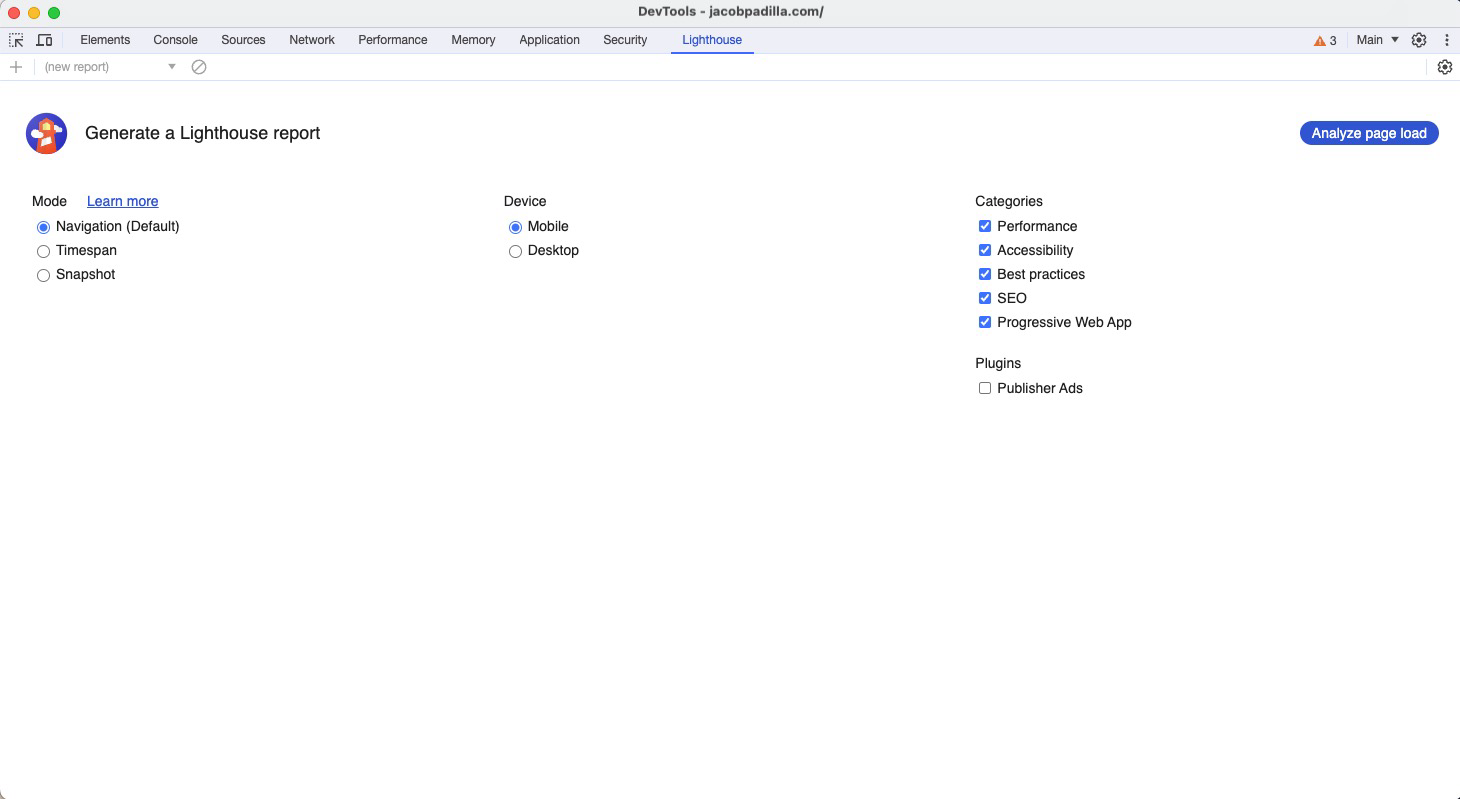
The last but very useful tip is the Lighthouse performance tester. This tool lets you test key parts of your website and get feedback on what needs to be improved. This is super valuable as optimizing the things that Lighthouse tests for improves both user experiences and your SEO.
To test a page on your website, navigate to said page, select the metrics that you want Lighthouse to test, and then click “Analyze page load.”
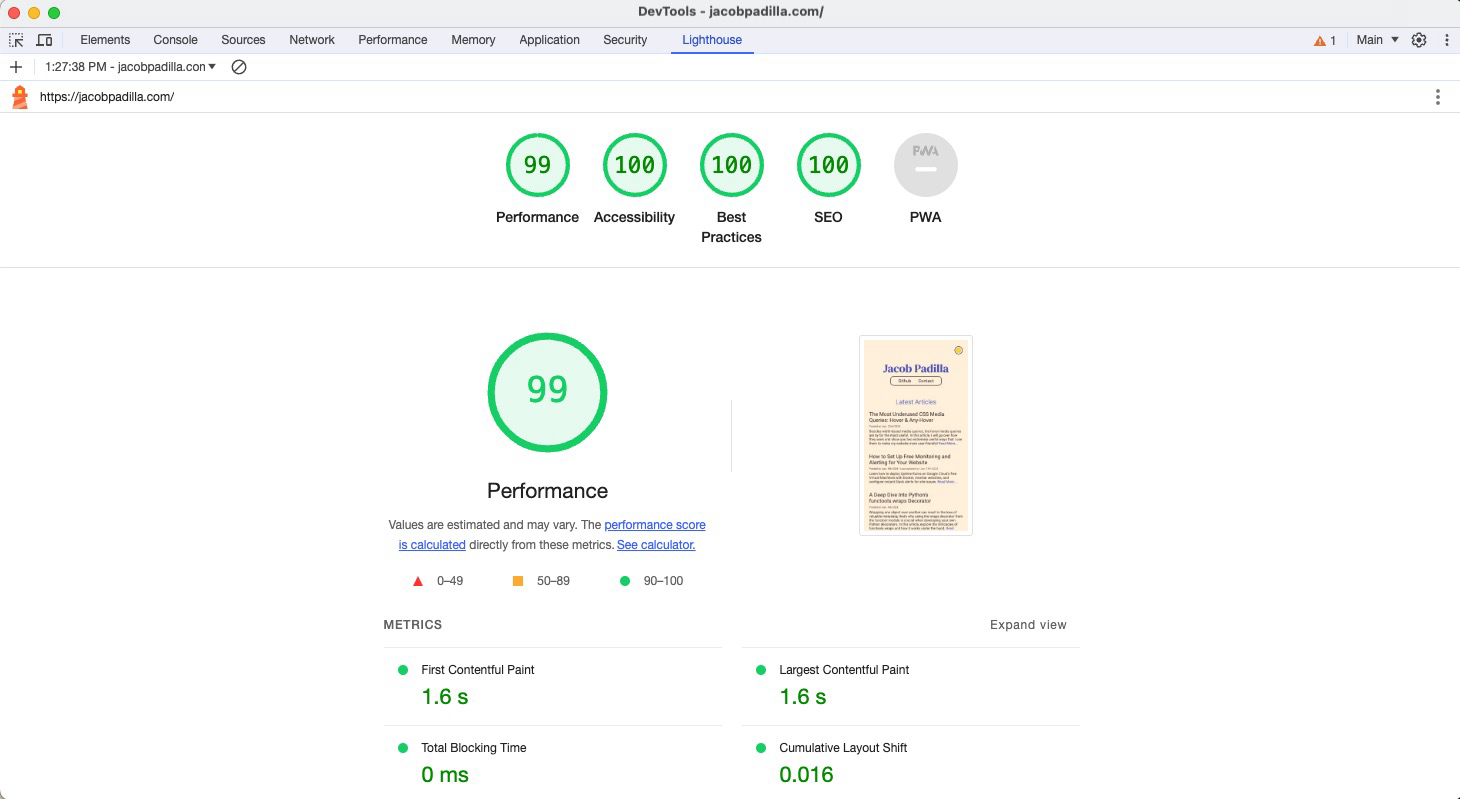
Lighthouse will generate a result with the metrics about your site. It looks like my website is doing pretty well :).
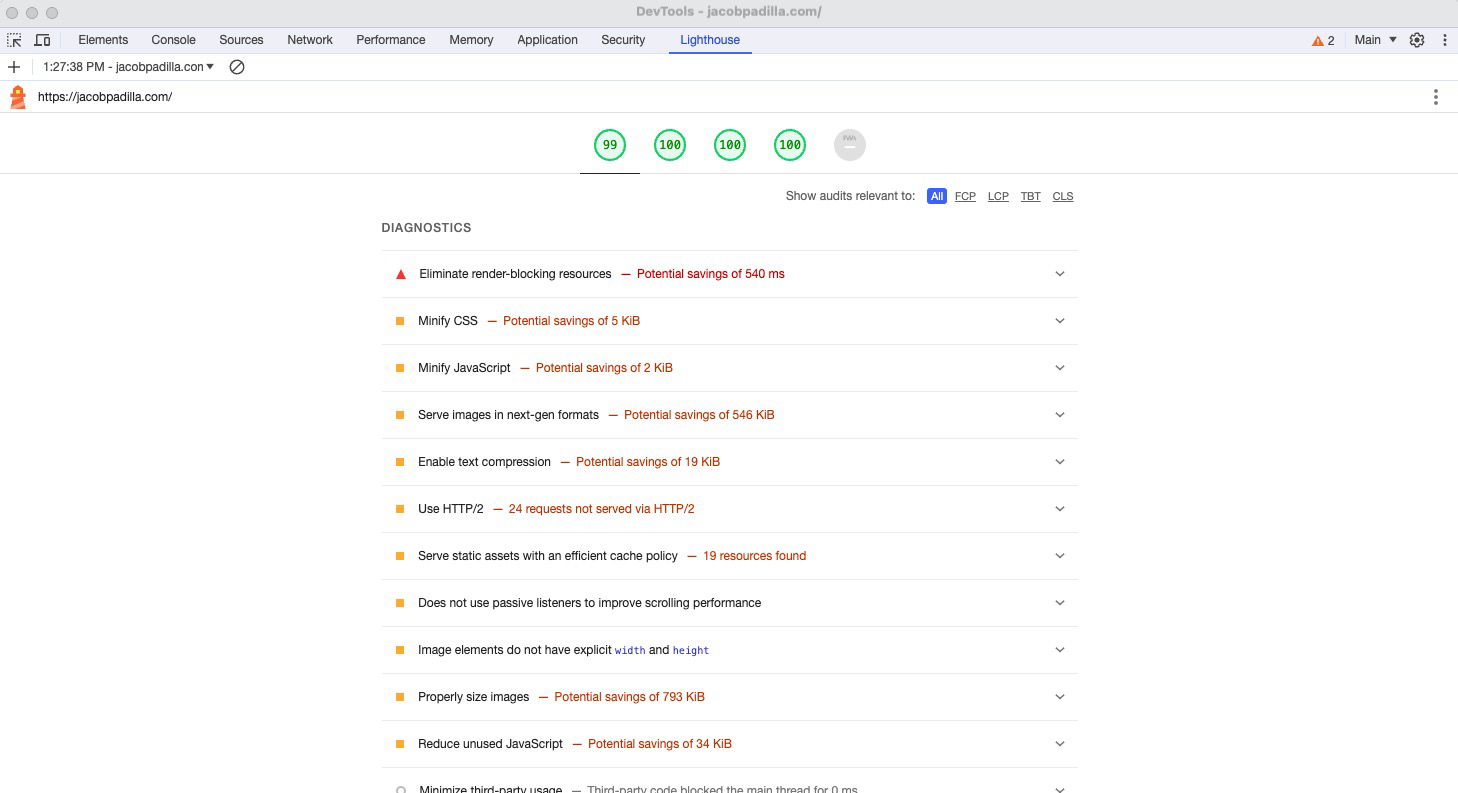
However, this is slightly misleading since if I scroll down a bit, I still get a bunch of recommendations on how I can make it even faster.
Conclusion
I hope you’ve learned something new about Chrome’s developer tools! Whether you’re a front-end developer using Inspect Elements to debug a web page or a back-end developer using the Network tab to trace API calls, Chrome offers developers an invaluable set of tools. There are also whole sections of Chrome DevTools that I didn’t mention, such as the Performance tab, which I may do a separate article on in the future!